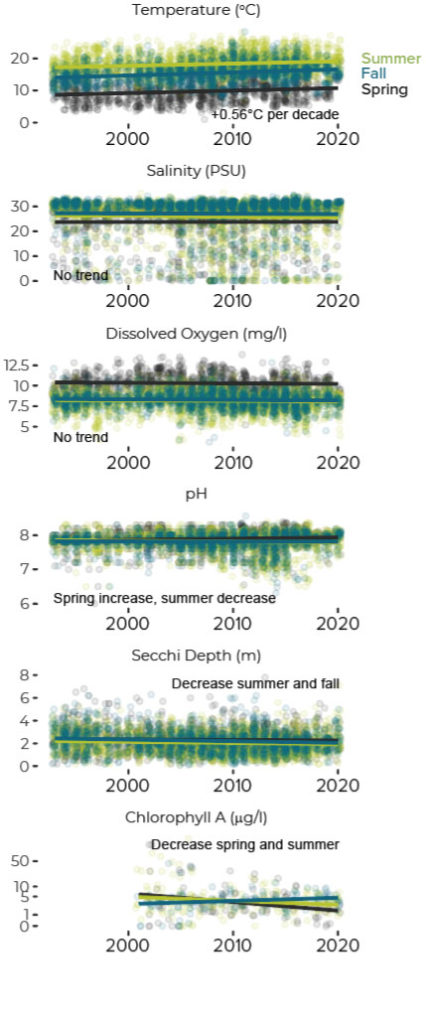
Water quality refers to physical, chemical, and biological properties of the waters in an aquatic ecosystem. This chapter focuses on six measures of water quality in the Bay: temperature, salinity, dissolved oxygen, water clarity, pH, and chlorophyll. These measures provide insight into how the biology of the Bay interacts with physical mixing processes to produce clean waters that support healthy fisheries and coastal ecosystems. The chapters on Nutrients, Shellfish and Swimming Beaches, and Coastal Acidification present closely related information on the Bay’s water quality.
Friends of Casco Bay (FOCB) staff and volunteers have monitored water quality at dozens of sites since the early 1990s, making it possible to develop an understanding of how the Bay is changing and how conditions vary among regions of the Bay. Recent adoption of new continuous monitoring technologies by FOCB, University of Maine, and Maine Department of Environmental Protection is further expanding our understanding of water quality.
Water quality refers to physical, chemical, and biological properties of the waters in an aquatic ecosystem. This chapter focuses on six measures of water quality in the Bay: temperature, salinity, dissolved oxygen, water clarity, pH, and chlorophyll. These measures provide insight into how the biology of the Bay interacts with physical mixing processes to produce clean waters that support healthy fisheries and coastal ecosystems. The chapters on
Nutrients,
Shellfish and Swimming Beaches, and
Coastal Acidification present closely related information on the Bay’s water quality.