Population and Land Use

Drivers and Stressors

New Suburban Construction Eats into Forests and Agricultural Lands

Population of Casco Bay Watershed Grew Nearly 10 Percent in 18 Years

WHY IT MATTERS

Broad social and economic trends, including population growth, contribute to changing patterns in where people work and live in the Casco Bay region and, in turn, the intensity of human impacts. Many environmental stressors affecting the Bay stem from changes in land use in the watershed, particularly the conversion of undeveloped areas such as fields and forests to roads, buildings, parking lots, and driveways. These impervious surfaces cause more precipitation to run off the land, carrying pollutants into streams and lakes. Suburban sprawl contributes to degraded aquatic ecosystems, fragmentation of forests, loss of access to open space, and declines in fish and wildlife habitat.
A large paved parking lot
Covering land with pavement and other impervious surfaces causes more precipitation to run off into streams and lakes, carrying pollutants into aquatic ecosystems. Photo: Jerry Monkman, Ecophotography.com
Changes in Population 2000 to 2018
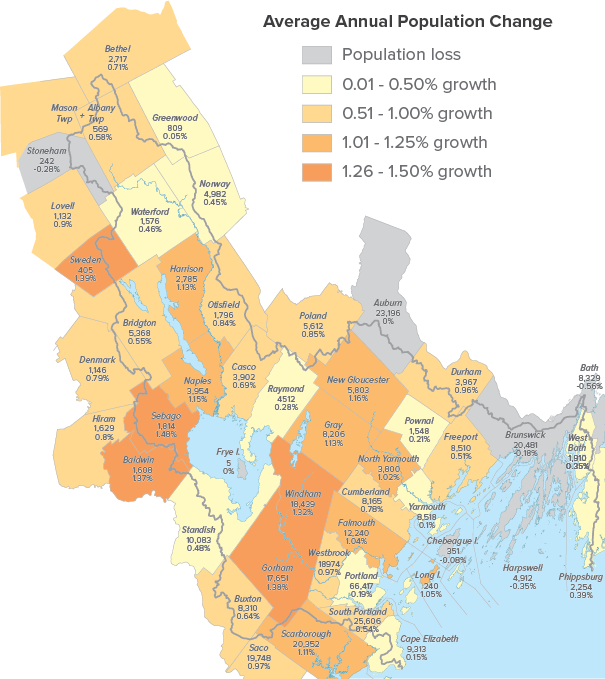
Darker orange indicates higher rates of population growth from 2000 to 2018. For each municipality, the map lists population in 2018 and average annual percent change. Source: IPUMS NHGIS, University of Minnesota

STATUS

Between 2000 and 2018, the combined population of the municipalities making up the Casco Bay watershed grew by an estimated 9.9% (33,678). Communities in closer proximity to the urban core of Portland had the largest increases in population.
Rebound in Residential Building Permits (All Watershed Towns and Cities)
After hitting a low of 722 total units in 2011, residential housing permits rebounded annually from 2011 to 2018, when total units reached 1,784. Source: U.S. Department of Housing and Urban Development, Office of Policy Development and Research, State of the Cities Data Systems
Land cover in the Casco Bay watershed includes forested 60 percent, developed 13 percent, water and submerged lands 9 percent, emergent wetland 9 percent, agriculture 6 percent, grassland 1 percent, scrub shrub 1 percent, and barren land 1 percent.
Land Cover in Casco Bay Watershed: 2016
Source: National Land Cover Database
Loss of Forested and Agricultural Land, Increase in Developed Land: 2001–2016
In a continuation of recent trends, the total area of forested and agricultural lands in the watershed declined by 3.35 square miles from 2011 to 2016. The total area of developed lands expanded by 1.13 square miles.

successes & challenges

  • Individual towns and cities have been successful in applying Smart Growth approaches to balance economic growth and development with agricultural, forestry, open space, and other community values, but home-rule decision making results in irregular regional growth and development patterns.  

  • Many land use planning and conservation tools such as comprehensive planning, open space planning, conservation subdivision design, and wetland and shoreland zoning are available to guide local development while protecting water quality and habitat. Casco Bay communities can choose where and how to direct growth through planning and land use ordinances.

  • Within the region, ample opportunities exist for redevelopment in growth areas and for allowing increased density to accommodate development that does not expand impervious surfaces. However, regulations aimed at restoring impaired water bodies may create disincentives for doing so. 

  • Many challenges such as urban sprawl and traffic congestion are regional in nature, but towns handle solutions quite differently. Better support and funding for regional planning is greatly needed to provide technical assistance on a regional level for issues related to transportation and open space planning. 

STATE OF CASCO BAY